Demographics of Afghanistan
| Demographics of Afghanistan | |
|---|---|
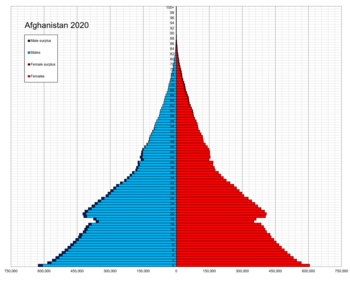 Afghanistan population pyramid in 2020 | |
| Population | 41,454,761[1] (2023) |
| Growth rate | |
| Birth rate | 35.44/1000 (2023)[3] |
| Death rate | 5.80/1000 (2023)[4] |
| Life expectancy | |
| Fertility rate | 4.84 children per woman (2023)[5] |
| Infant mortality rate | ▼44.0/1000 (2023)[6] |
| Nationality | |
| Nationality | Afghan |
| Major ethnic | |
| Minor ethnic | |

The population of Afghanistan is around 43.4 million as of 2024.[7] The nation is composed of a multi-ethnic and multilingual society, reflecting its location astride historic trade and invasion routes between Central Asia, South Asia, and Western Asia. Ethnic groups in the country include Pashtun, Tajik, Hazara, Uzbek, as well as smaller groups such as Baloch, Nuristani, Turkmen, Aimaq, Mongol and some others which are less known.[8][9][10][11][12][13][14] Together they make up the contemporary Afghan people.
Approximately 43% of the population is under 15 years of age, and 74% of all Afghans live in rural areas.[15] The average woman gives birth to five children during her entire life, the highest fertility rate outside of Africa. About 6.8% of all babies die in child-birth or infancy.[15] The average life expectancy of the nation was reported in 2019 at around 63 years,[16][17] and only 0.04% of the population has HIV.[13]
Persian (Dari) and Pashto are the official languages of the country.[18] Dari functions as the inter-ethnic lingua franca for the vast majority. Pashto is widely used in the regions south of the Hindu Kush mountains and as far as the Indus River in neighbouring Pakistan. Uzbek and Turkmen are smaller languages spoken in parts of the north.[13] Multilingualism is common throughout the country, especially in the major cities. Successive Afghan governments have given preferential treatment to Pashto despite it being a minority language. Birth certificates, passports, and the national anthem are exclusively in Pashto to the ire of Non-Pashto speakers.
Up to 69.7% of the population practices Sunni Islam and belongs to the Hanafi Islamic law school, while 30–35% are followers of Shia Islam;[13][19] the majority of whom belong to the Twelver branch, with smaller numbers of Ismailis. The remaining 0.3% practice other religions such as Sikhism and Hinduism. Excluding urban populations in the principal cities, most people are organised into tribal and other kinship-based groups, who follow their own traditional customs.
Population size and structure
[edit]Anatol Lieven of Georgetown University in Qatar wrote in 2021 that "it may be noted that in the whole of modern Afghan history there has never been a census that could be regarded as remotely reliable."[20]
Historical
[edit]
The first and only nationwide census of Afghanistan was carried out in 1979. It revealed a population of 13,051,358 (rural 11,037,231, urban 2,014,127).[21] Previously there had been scattered attempts to conduct censuses in individual cities.[22] According to the 1876 census, Kabul had a population of 140,700 people.[23] In Kandahar in 1891 a population census was carried out, according to which 31,514 people lived in the city, of which 16,064 were men and 15,450 were women.[24]
From 1979 until the end of 1983, some 5 million people left the country to take shelter in neighbouring northwestern Pakistan and eastern Iran. This exodus was largely unchecked by any government. The Afghan government in 1983 reported a population of 15.96 million, which presumably included the exodus.[25]
It is assumed that roughly 600,000 to as high as 2 million Afghans may have been killed during the various 1979–2001 wars.[26] These figures are questionable and no attempt has ever been made to verify if they were actually killed or had moved to neighbouring countries as refugees.[25]
As no census has been performed after 1979 and millions of people may have left the country, the current population of Afghanistan can only be guessed.
Current and latest
[edit]As of 2021, the total population of Afghanistan is around 37.5 million,[13][27] which includes the 3 million Afghan nationals living in both Pakistan and Iran.[28] About 26% of the population is urbanite and the remaining 74% lives in rural areas.[13]
Afghanistan's Central Statistics Organization (CSO) stated in 2011 that the total number of Afghans living inside Afghanistan was about 26 million[28] and by 2017 it reached 29.2 million. Of this, 15 million are males and 14.2 million are females.[29] The country's population is expected to reach 82 million by 2050.[30]
Urban areas have experienced rapid population growth in the last decade, which is due to the return of over 5 million expats. The only city in Afghanistan with over a million residents is its capital, Kabul.
Structure of the population
[edit]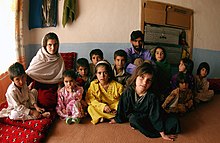
Structure of the population (2012.01.07) (Data refer to the settled population based on the 1979 Population Census and the latest household prelisting. The refugees of Afghanistan in Iran, Pakistan, and an estimated 1.5 million nomads, are not included):[31]
Population Estimates by Sex and Age Group (01.VII.2012) (Data refer to the settled population based on the 1979 Population Census and the latest household prelisting. The refugees of Afghanistan in Iran, Pakistan, and an estimated 1.5 million nomads, are not included.):
| Age Group | Male | Female | Total | % |
|---|---|---|---|---|
| Total | 13,044,400 | 12,455,700 | 25,500,100 | 100 |
| 0–4 | 2,422,244 | 2,556,304 | 4,978,548 | 19.52 |
| 5–9 | 1,941,363 | 1,880,407 | 3,821,770 | 14.99 |
| 10–14 | 1,556,158 | 1,401,695 | 2,957,853 | 11.60 |
| 15–19 | 1,276,563 | 1,140,810 | 2,417,373 | 9.48 |
| 20–24 | 1,059,939 | 1,009,807 | 2,069,746 | 8.12 |
| 25–29 | 843 967 | 864 738 | 1,708,705 | 6.70 |
| 30–34 | 678 577 | 745 534 | 1,424,111 | 5.58 |
| 35–39 | 598 045 | 652 326 | 1,250,371 | 4.90 |
| 40–44 | 546 102 | 533 524 | 1,079,626 | 4.23 |
| 45–49 | 495 190 | 440 789 | 935 979 | 3.67 |
| 50–54 | 435 143 | 354 633 | 789 776 | 3.10 |
| 55–59 | 360 394 | 275 468 | 635 862 | 2.49 |
| 60–64 | 281 627 | 209 152 | 490 779 | 1.92 |
| 65–69 | 204 376 | 150 137 | 354 513 | 1.39 |
| 70–74 | 141 729 | 102 048 | 243 777 | 0.96 |
| 75–79 | 91 164 | 64 658 | 155 822 | 0.61 |
| 80–84 | 55 446 | 38 699 | 94 145 | 0.37 |
| 85+ | 56 373 | 34 971 | 91 344 | 0.36 |
| Age group | Male | Female | Total | Percent |
| 0–14 | 5,919,765 | 5,838,406 | 11,758,171 | 46.11 |
| 15–64 | 6,575,547 | 6,226,781 | 12,802,328 | 50.21 |
| 65+ | 549 088 | 390 513 | 939 601 | 3.68 |
Population Estimates by Sex and Age Group (01.VII.2020) (Data refer to the settled population based on the 1979 Population Census and the latest household prelisting. The refugees of Afghanistan in Iran, Pakistan, and an estimated 1.5 million nomads, are not included.):[32]
| Age Group | Male | Female | Total | % |
|---|---|---|---|---|
| Total | 15,981,303 | 15,408,868 | 31,390,171 | 100 |
| 0–4 | 2,853,288 | 2,743,103 | 5,596,391 | 17.83 |
| 5–9 | 2,542,405 | 2,379,618 | 4,922,023 | 15.68 |
| 10–14 | 2,220,065 | 2,026,796 | 4,246,861 | 13.53 |
| 15–19 | 1,840,432 | 1,727,287 | 3,567,719 | 11.37 |
| 20–24 | 1,371,188 | 1,463,797 | 2,834,985 | 9.03 |
| 25–29 | 1,079,117 | 1,177,555 | 2,256,672 | 7.19 |
| 30–34 | 828 055 | 818 313 | 1,646,368 | 5.24 |
| 35–39 | 674 920 | 661 949 | 1,336,869 | 4.26 |
| 40–44 | 577 135 | 611 016 | 1,188,151 | 3.79 |
| 45–49 | 480 700 | 511 608 | 992 308 | 3.16 |
| 50–54 | 381 772 | 396 026 | 777 798 | 2.48 |
| 55–59 | 320 024 | 308 966 | 628 990 | 2.00 |
| 60–64 | 286 732 | 229 605 | 516 337 | 1.64 |
| 65–69 | 222 590 | 161 851 | 384 441 | 1.22 |
| 70–74 | 150 436 | 99 412 | 249 848 | 0.80 |
| 75–79 | 70 271 | 42 288 | 112 559 | 0.36 |
| 80–84 | 48 540 | 26 549 | 75 089 | 0.24 |
| 85+ | 33 633 | 23 129 | 56 762 | 0.18 |
| Age group | Male | Female | Total | Percent |
| 0–14 | 7,615,758 | 7,149,517 | 14,765,275 | 47.04 |
| 15–64 | 7,840,075 | 7,906,122 | 15,746,197 | 50.16 |
| 65+ | 525 470 | 353 229 | 878 699 | 2.80 |
Vital statistics
[edit]UN estimates
[edit]| Period | Population | Live births | Deaths | Rate of Natural change % | Crude Migration rate (per 1000) | CBR1 | CDR1 | NC1 | TFR1 | Life expectancy (in years) | IMR1 |
|---|---|---|---|---|---|---|---|---|---|---|---|
| 1950 | 7,480,464 | 365,303 | 283,668 | +1.09% | 48.9 | 37.9 | 10.9 | 7.25 | 27.73 | 285.8 | |
| 1951 | 7,571,542 | 372,040 | 282,577 | +1.18% | 0.2 | 49.1 | 37.3 | 11.8 | 7.26 | 27.96 | 283.6 |
| 1952 | 7,667,534 | 378,290 | 280,803 | +1.27% | −0.2 | 49.3 | 36.6 | 12.7 | 7.26 | 28.45 | 278.8 |
| 1953 | 7,764,549 | 384,933 | 279,684 | +1.35% | −1.0 | 49.5 | 36.0 | 13.5 | 7.27 | 28.93 | 273.9 |
| 1954 | 7,864,289 | 390,412 | 280,476 | +1.40% | −1.3 | 49.6 | 35.6 | 14.0 | 7.25 | 29.23 | 269.4 |
| 1955 | 7,971,933 | 397,156 | 277,695 | +1.50% | −1.5 | 49.8 | 34.8 | 15.0 | 7.26 | 29.92 | 264.1 |
| 1956 | 8,087,730 | 404,134 | 277,328 | +1.57% | −1.4 | 49.9 | 34.3 | 15.7 | 7.27 | 30.41 | 259.3 |
| 1957 | 8,210,207 | 410,977 | 276,560 | +1.64% | −1.5 | 50.0 | 33.7 | 16.4 | 7.26 | 30.95 | 254.4 |
| 1958 | 8,333,827 | 418,266 | 275,681 | +1.71% | −2.3 | 50.1 | 33.0 | 17.1 | 7.27 | 31.51 | 249.5 |
| 1959 | 8,468,220 | 425,334 | 274,920 | +1.78% | −1.9 | 50.2 | 32.5 | 17.8 | 7.28 | 32.04 | 244.9 |
| 1960 | 8,622,473 | 434,057 | 275,239 | +1.84% | −0.5 | 50.3 | 31.9 | 18.4 | 7.28 | 32.54 | 240.5 |
| 1961 | 8,790,140 | 443,319 | 275,508 | +1.91% | 0 | 50.4 | 31.3 | 19.1 | 7.28 | 33.07 | 236.2 |
| 1962 | 8,969,055 | 453,468 | 276,593 | +1.97% | 0.2 | 50.6 | 30.8 | 19.7 | 7.29 | 33.55 | 232.2 |
| 1963 | 9,157,463 | 464,225 | 277,961 | +2.03% | 0.3 | 50.7 | 30.4 | 20.3 | 7.30 | 34.02 | 228.2 |
| 1964 | 9,355,510 | 475,452 | 279,368 | +2.10% | 0.2 | 50.8 | 29.9 | 21.0 | 7.30 | 34.49 | 224.3 |
| 1965 | 9,565,154 | 486,406 | 281,003 | +2.15% | 0.4 | 50.9 | 29.4 | 21.5 | 7.31 | 34.95 | 220.6 |
| 1966 | 9,783,153 | 498,801 | 282,463 | +2.21% | 0.2 | 51.0 | 28.9 | 22.1 | 7.32 | 35.45 | 216.6 |
| 1967 | 10,010,037 | 511,245 | 284,203 | +2.27% | 0.0 | 51.1 | 28.4 | 22.7 | 7.34 | 35.92 | 212.9 |
| 1968 | 10,247,782 | 524,167 | 285,867 | +2.33% | −0.1 | 51.1 | 27.9 | 23.3 | 7.36 | 36.42 | 209.1 |
| 1969 | 10,494,491 | 537,318 | 287,557 | +2.38% | −0.3 | 51.2 | 27.4 | 23.8 | 7.39 | 36.91 | 205.3 |
| 1970 | 10,752,973 | 549,695 | 288,979 | +2.42% | −0.2 | 51.1 | 26.9 | 24.2 | 7.40 | 37.42 | 201.5 |
| 1971 | 11,015,853 | 564,040 | 290,646 | +2.48% | −0.9 | 51.2 | 26.4 | 24.8 | 7.43 | 37.92 | 197.7 |
| 1972 | 11,286,753 | 577,071 | 291,819 | +2.53% | −1.3 | 51.1 | 25.8 | 25.3 | 7.45 | 38.44 | 194.0 |
| 1973 | 11,575,308 | 591,855 | 292,915 | +2.58% | −0.9 | 51.1 | 25.3 | 25.8 | 7.49 | 39.00 | 190.1 |
| 1974 | 11,869,881 | 607,606 | 294,363 | +2.64% | −1.6 | 51.1 | 24.8 | 26.4 | 7.53 | 39.55 | 186.2 |
| 1975 | 12,157,390 | 621,494 | 295,301 | +2.68% | −3.2 | 51.0 | 24.2 | 26.8 | 7.54 | 40.10 | 182.2 |
| 1976 | 12,425,276 | 635,188 | 295,770 | +2.72% | −5.6 | 50.9 | 23.7 | 27.2 | 7.56 | 40.65 | 178.3 |
| 1977 | 12,687,308 | 648,307 | 295,112 | +2.77% | −7.0 | 50.9 | 23.2 | 27.7 | 7.59 | 41.23 | 174.2 |
| 1978 | 12,938,864 | 660,606 | 310,376 | +2.69% | −7.5 | 50.8 | 23.9 | 26.9 | 7.60 | 40.27 | 172.7 |
| 1979 | 12,986,378 | 671,213 | 328,042 | +2.64% | −22.7 | 50.7 | 24.8 | 25.9 | 7.61 | 39.09 | 171.7 |
| 1980 | 12,486,640 | 660,892 | 316,937 | +2.75% | −67.5 | 50.5 | 24.2 | 26.3 | 7.59 | 39.62 | 167.8 |
| 1981 | 11,155,196 | 614,273 | 288,555 | +2.92% | −148.6 | 50.3 | 23.6 | 26.7 | 7.57 | 40.16 | 163.6 |
| 1982 | 10,088,290 | 520,603.03 | 266,040 | +2.52% | −131.0 | 50.1 | 25.6 | 24.5 | 7.55 | 37.77 | 165.2 |
| 1983 | 9,951,447 | 503,887 | 252,318 | +2.50% | −38.8 | 50.1 | 25.1 | 25.0 | 7.54 | 38.19 | 161.4 |
| 1984 | 10,243,689 | 506,571 | 302,824 | +2.02% | 8.3 | 50.2 | 30.0 | 20.2 | 7.51 | 33.33 | 169.7 |
| 1985 | 10,512,220 | 536,861 | 314,987 | +2.09% | 4.6 | 50.6 | 29.7 | 20.9 | 7.52 | 33.55 | 166.4 |
| 1986 | 10,448,447 | 541,017 | 252,810 | +2.76% | −33.7 | 50.7 | 23.7 | 27.0 | 7.52 | 39.40 | 150.3 |
| 1987 | 10,322,767 | 535,214 | 245,107 | +2.81% | −40.3 | 50.8 | 23.3 | 27.6 | 7.53 | 39.84 | 146.5 |
| 1988 | 10,383,459 | 531,795 | 208,051 | +3.10% | −25.2 | 51.0 | 19.9 | 31.0 | 7.53 | 43.96 | 136.0 |
| 1989 | 10,673,172 | 546,142 | 203,321 | +3.21% | −5.0 | 51.2 | 19.0 | 32.1 | 7.53 | 45.16 | 131.1 |
| 1990 | 10,694,804 | 567,256 | 203,514 | +3.40% | −32.0 | 51.4 | 18.4 | 33.0 | 7.56 | 45.97 | 127.0 |
| 1991 | 10,745,168 | 555,610 | 192,531 | +3.38% | −29.1 | 51.8 | 17.9 | 33.8 | 7.61 | 46.66 | 123.4 |
| 1992 | 12,057,436 | 578,891 | 191,913 | +3.21% | 76.7 | 51.9 | 17.2 | 34.7 | 7.66 | 47.60 | 118.3 |
| 1993 | 14,003,764 | 698,469 | 199,165 | +3.57% | 103.3 | 52.0 | 14.8 | 37.2 | 7.72 | 51.47 | 110.8 |
| 1994 | 15,455,560 | 789,282 | 222,214 | +3.67% | 57.2 | 52.2 | 14.7 | 37.5 | 7.72 | 51.50 | 107.0 |
| 1995 | 16,418,911 | 853,355 | 230,943 | +3.80% | 20.7 | 52.1 | 14.1 | 38.0 | 7.71 | 52.54 | 104.2 |
| 1996 | 17,106,600 | 886,917 | 232,991 | +3.82% | 2.0 | 51.9 | 13.6 | 38.2 | 7.71 | 53.24 | 101.2 |
| 1997 | 17,788,818 | 914,412 | 237,216 | +3.81% | 0.3 | 51.4 | 13.3 | 38.1 | 7.67 | 53.63 | 98.9 |
| 1998 | 18,493,134 | 940,233 | 250,677 | +3.73% | 0.8 | 50.9 | 13.6 | 37.3 | 7.64 | 52.94 | 97.0 |
| 1999 | 19,262,854 | 967,977" | 239,604 | +3.79% | 2.1 | 50.4 | 12.5 | 37.9 | 7.60 | 54.85 | 93.4 |
| 2000 | 19,542,986 | 995,813 | 242,535 | +3.76% | −23.3 | 49.7 | 12.1 | 37.6 | 7.53 | 55.30 | 90.8 |
| 2001 | 19,688,634 | 969,246 | 231,795 | +3.73% | −29.9 | 49.0 | 11.7 | 37.3 | 7.45 | 55.80 | 88.4 |
| 2002 | 21,000,258 | 980,458 | 229,450 | +3.58% | 26.7 | 48.2 | 11.3 | 36.9 | 7.34 | 56.45 | 85.8 |
| 2003 | 22,645,136 | 1,063,246 | 240,215 | +3.63% | 36.3 | 47.4 | 10.7 | 36.7 | 7.22 | 57.34 | 82.6 |
| 2004 | 23,553,554 | 1,097,160 | 243,367 | +3.61% | 2.5 | 46.3 | 10.3 | 36.1 | 7.07 | 57.94 | 79.9 |
| 2005 | 24,411,196 | 1,099,366 | 241,454 | +3.53% | −0.2 | 45.3 | 9.9 | 35.3 | 6.91 | 58.36 | 77.5 |
| 2006 | 25,442,946 | 1,136,774 | 246,037 | +3.50% | 5.6 | 44.7 | 9.7 | 35.0 | 6.72 | 58.68 | 74.9 |
| 2007 | 25,903,306 | 1,156,957 | 246,898 | +3.51% | −17.3 | 43.9 | 9.4 | 34.5 | 6.53 | 59.11 | 71.9 |
| 2008 | 26,427,204 | 1,091,824 | 232,339 | +3.27% | −12.9 | 41.5 | 8.8 | 32.7 | 6.38 | 59.85 | 69.2 |
| 2009 | 27,385,310 | 1,128,666 | 234,065 | +3.26% | 2.4 | 41.2 | 8.5 | 32.6 | 6.24 | 60.36 | 67.2 |
| 2010 | 28,189,672 | 1,147,643 | 233,308 | +3.23% | −3.8 | 40.6 | 8.3 | 32.3 | 6.10 | 60.85 | 64.8 |
| 2011 | 29,249,156 | 1,157,518 | 230,346 | +3.19% | 4.3 | 39.9 | 7.9 | 31.9 | 5.96 | 61.42 | 62.3 |
| 2012 | 30,466,484 | 1,217,396 | 234,629 | +3.23% | 7.7 | 40.0 | 7.7 | 32.3 | 5.83 | 61.92 | 60.0 |
| 2013 | 31,541,216 | 1,248,455 | 235,744 | +3.21% | 2.0 | 39.6 | 7.5 | 32.1 | 5.70 | 62.42 | 57.8 |
| 2014 | 32,716,214 | 1,274,665 | 241,055 | +3.17% | 4.2 | 39.1 | 7.4 | 31.7 | 5.56 | 62.55 | 56.3 |
| 2015 | 33,753,500 | 1,315,633 | 248,560 | +3.15% | −0.8 | 38.8 | 7.3 | 31.5 | 5.41 | 62.66 | 54.5 |
| 2016 | 34,636,212 | 1,315,746 | 245,452 | +3.09% | −5.4 | 37.9 | 7.1 | 30.9 | 5.26 | 63.14 | 52.5 |
| 2017 | 35,643,420 | 1,332,116 | 250,677 | +3.03% | −2.0 | 37.3 | 7.0 | 30.3 | 5.13 | 63.02 | 49.4 |
| 2018 | 36,686,788 | 1,355,895 | 256,314 | +2.99% | −1.5 | 36.9 | 7.0 | 29.9 | 5.00 | 63.08 | 47.8 |
| 2019 | 37,769,496 | 1,377,704 | 256,564 | +2.97% | −1.0 | 36.5 | 6.8 | 29.7 | 4.87 | 63.57 | 46.7 |
| 2020 | 38,972,236 | 1,402,265 | 276,683 | +2.89% | 2.0 | 36.1 | 7.1 | 28.9 | 4.75 | 62.58 | 45.8 |
| 2021 | 40,099,460 | 1,440,941 | 295,236 | +2.85% | −0.4 | 35.8 | 7.3 | 28.5 | 4.64 | 61.98 | 44.7 |
| 2022 | 41,128,771 | +2.82% | −3.2 | 35.14 | 6.91 | 28.23 | 4.52 | 62.88 | 44.8 | ||
| 2023 | 42,239,854 | 4.41 | 64.23 | 37.7 | |||||||
| 1 CBR = crude birth rate (per 1000); CDR = crude death rate (per 1000); NC = natural change (per 1000); TFR = total fertility rate (number of children per woman); IMR = infant mortality rate per 1000 births | |||||||||||
| Source:[33] | |||||||||||
Graphs are unavailable due to technical issues. Updates on reimplementing the Graph extension, which will be known as the Chart extension, can be found on Phabricator and on MediaWiki.org. |
Graphs are unavailable due to technical issues. Updates on reimplementing the Graph extension, which will be known as the Chart extension, can be found on Phabricator and on MediaWiki.org. |
Graphs are unavailable due to technical issues. Updates on reimplementing the Graph extension, which will be known as the Chart extension, can be found on Phabricator and on MediaWiki.org. |
Graphs are unavailable due to technical issues. Updates on reimplementing the Graph extension, which will be known as the Chart extension, can be found on Phabricator and on MediaWiki.org. |
Demographic and Health Surveys
[edit]Afghanistan 2024 total fertility rate has been estimated at 4.4. [34] In 2022 it was 4.5, about twice the world average rate.[35] The rate has fallen since the early 1980s.[36]
Crude Birth Rate (CBR), Total Fertility Rate (TFR) and Wanted Fertility Rate (WFR):[37]
| year | crude birth rate (CBR) | total fertility rate (TFR) | wanted fertility rate (WFR) | ||||||
|---|---|---|---|---|---|---|---|---|---|
| total | urban | rural | total | urban | rural | total | urban | rural | |
| 2010 | 35.6 | 34.7 | 35.9 | 5.1 | 4.5 | 5.2 | |||
| 2015 | 36.8 |
35.8 |
37.1 |
5.3 |
4.8 |
5.4 |
4.4 |
3.7 |
4.6 |
| 2022–23 | 36.0 |
32.0 |
38.0 |
5.4 |
4.3 |
5.8 |
|||
Fertility data by province in 2015 DHS Survey[38] and 2022–23 MICS Survey:[39]
| Province | TFR | |
|---|---|---|
| 2015 | 2023 | |
| Afghanistan | 5.3 | 5.4 |
| Kabul | 4.6 | 3.8 |
| Kapisa | 4.8 | 5.6 |
| Parwan | 5.7 | 5.0 |
| Wardak | 4.2 | 5.3 |
| Logar | 4.2 | 6.2 |
| Nangarhar | 6.4 | 5.6 |
| Laghman | 7.3 | 6.2 |
| Panjshir | 3.2 | 3.5 |
| Baghlan | 4.4 | 5.4 |
| Bamyan | 5.4 | 4.2 |
| Ghazni | 2.8 | 5.6 |
| Paktika | 5.3 | 6.3 |
| Paktia | 5.2 | 5.7 |
| Khost | 5.6 | 5.3 |
| Kunar | 6.8 | 6.4 |
| Nuristan | 8.9 | 5.6 |
| Badakhshan | 5.3 | 5.1 |
| Takhar | 5.7 | 5.9 |
| Kunduz | 4.4 | 6.4 |
| Samangan | 5.1 | 4.3 |
| Balkh | 5.5 | 4.9 |
| Sar-e Pol | 4.8 | 5.5 |
| Ghor | 5.8 | 4.8 |
| Daykundi | 5.2 | 4.8 |
| Urozgan | 8.8 | 5.6 |
| Zabul | 5.1 | 7.8 |
| Kandahar | 6.5 | 6.3 |
| Jawzjan | 3.9 | 5.5 |
| Faryab | 6.2 | 6.4 |
| Helmand | 4.7 | 7.3 |
| Badghis | 6.6 | 5.8 |
| Herat | 4.8 | 4.4 |
| Farah | 5.4 | 7.1 |
| Nimruz | 5.4 | 6.2 |
Life expectancy
[edit]
| Period | Life expectancy in Years |
Period | Life expectancy in Years |
|---|---|---|---|
| 1950–1955 | 28.6 | 1985–1990 | 47.7 |
| 1955–1960 | 31.1 | 1990–1995 | 51.7 |
| 1960–1965 | 33.4 | 1995–2000 | 54.2 |
| 1965–1970 | 35.6 | 2000–2005 | 56.9 |
| 1970–1975 | 37.8 | 2005–2010 | 60.0 |
| 1975–1980 | 40.4 | 2010–2015 | 62.3 |
| 1980–1985 | 43.6 | 2015–2020 | 63.2 |
Source: UN World Population Prospects[40]
Ethnic groups
[edit]An approximate distribution of the ethnolinguistic groups are listed in the chart below:[citation needed]
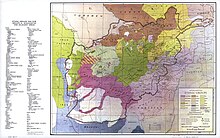
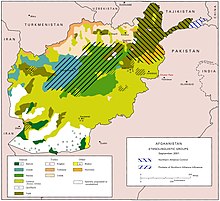
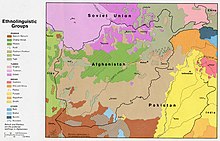
| Ethnic group | Image | 2024 estimate based on native mother tongue[41] | 2023 estimate based on native mother tongue[42] | 2013 estimate[43] | Pre-2004 estimates [44][45][46][47][48][49][50] |
|---|---|---|---|---|---|
| Pashtun | 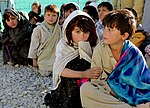
|
45% | 52.4% | 42% | 38–70% |
| Tajik | 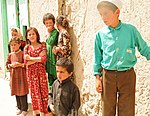
|
33%[A] | 32.1%[B] | 27% | 12–35% |
| Hazara | 
|
9% | 3–19% | ||
| Uzbek | 
|
7% | 8.8% | 9% | 6–8% |
| Aimak | – | – | 4% | – | |
| Turkmen | 3% | 1.9% | 3% | 2–2.5% | |
| Baloch | 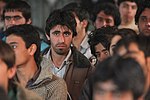
|
1% | 0.9% | 2% | – |
| Others (Pashai, Nuristani, Arab, Brahui, Qizilbash, Pamiri, etc.) | 
|
11% | 3.9% | 4% | 1–12% |
The recent estimate in the above chart is somewhat supported by the below national opinion polls, which were aimed at knowing how a group of about 804 to 8,706 local residents in Afghanistan felt about the current war, political situation, as well as the economic and social issues affecting their daily lives. Ten surveys were conducted between 2004 and 2015 by the Asia Foundation (a sample is shown in the table below; the survey in 2015 did not contain information on the ethnicity of the participants) and one between 2004 and 2009 by a combined effort of the broadcasting companies NBC News, BBC, and ARD.[51][52]
| Ethnic group | "Afghanistan: Where Things Stand" (2004)[52] "A survey of the Afghan people" (2004)[51] |
"Afghanistan: Where Things Stand" (2005)[52] | "Afghanistan: Where Things Stand" (2006)[52] | "Afghanistan: Where Things Stand" (2007)[52] | "A survey of the Afghan people" (2007)[51] | "Afghanistan: Where Things Stand" (2009)[52] | "A survey of the Afghan people" (2012)[51] | "A survey of the Afghan people" (2014)[51] | "A survey of the Afghan people" (2018)[51] | "A survey of the Afghan people" (2019)[51] |
|---|---|---|---|---|---|---|---|---|---|---|
| Pashtun | 46% | 40% | 42% | 38% | 40.1% | 40% | 40% | 40% | 37% | 39% |
| Tajik | 39% | 37% | 37% | 38% | 35.1% | 37% | 33% | 36% | 37% | 37% |
| Hazara | 6% | 13% | 12% | 6% | 10.0% | 11% | 11% | 10% | 10% | 11% |
| Uzbek | 6% | 6% | 5% | 6% | 8.1% | 7% | 9% | 8% | 9% | 8% |
| Aimak | 0% | 0% | 0% | 0% | 0.8% | 0% | 1% | 1% | 1% | <0.5% |
| Turkmen | 1% | 1% | 3% | 2% | 3.1% | 2% | 2% | 2% | 2% | 2% |
| Baloch | 0% | 0% | 0% | 3% | 0.7% | 1% | 1% | 1% | 1% | <0.5% |
| Others (Pashayi, Nuristani, Kurdish, Arab, Qizilbash.) | 3% | 3% | 1% | 5% | 2.1% | 3% | 3% | 2% | 2% | 3% |
| Don't know | -% | -% | -% | -% | -% | -% | -% | -% | 1% | -% |
Languages
[edit]Dari and Pashto are both official languages of Afghanistan.[18]
Uzbek and Turkmen are spoken as native languages in northern provinces, mainly among the Uzbeks and Turkmens. Smaller number of Afghans are also fluent in English, Urdu, Balochi, Arabic and other languages. An approximate distribution of languages spoken in the country is shown in the chart below:
| Language | Recent estimate including both L1 and L2 speakers[53] | Pre-1992 estimates including both L1 and L2 speakers[45][54][55] | ||||||
|---|---|---|---|---|---|---|---|---|
| Dari Persian (incl. Eastern, Hazaragi & Aimaqi) | 48% | 37–47% (incl. 25–50% Eastern, 9% Hazaragi & 3% Aimaqi) | ||||||
| Pashto (incl. Northern and Southern) | 78% | 78–90% | ||||||
| Uzbek | 11% | 9% | ||||||
| English | 6% | |||||||
| Turkmen | 3% | 500,000 speakers | ||||||
| Urdu | 3% | |||||||
| Pashayi | 1% | |||||||
| Nuristani | 1% | |||||||
| Arabic | 1% | |||||||
| Balochi | 1% | 200,000 | ||||||
| 1 note: data represent most widely spoken languages; shares sum to more than 100% because there is much bilingualism in the country and because respondents were allowed to select more than one language note: the Turkic languages Uzbek and Turkmen, as well as Balochi, Pashayi, Nuristani, and Pamiri are the third official languages in areas where the majority speaks them[53] | ||||||||
Based on information from the latest national opinion polls, up to 51% stated that they can speak or understand Pashto and up to 79% stated that they can speak or understand Dari. Uzbek was spoken or understood by up to 11% and Turkmen by up to 7%. Other languages that can be spoken are Arabic (4%) and Balochi (2%).[51][52]
Religion
[edit]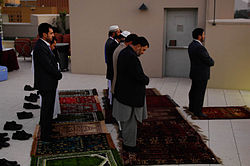
Almost the entire Afghan population is Muslim, with less than 1% being non-Muslim. Despite attempts to secularise Afghan society, Islamic practices pervade all aspects of life. Likewise, Islamic religious tradition and codes, together with traditional practices, provide the principal means of controlling personal conduct and settling legal disputes. Islam was used as the main basis for expressing opposition to the progressive reforms of Afghanistan by King Amanullah in the 1920s.
The members of Sikh and Hindu communities are mostly concentrated in urban areas. They numbered hundreds of thousands in the 1970s but over 90% have since fled due to the Afghan wars and persecution.[57]
- Islam: 99.7% of the total population
- Sunni Muslim: 84.7–89.7%[13][19]
- Shia Muslim: 7[19]-15%[13][19]
- others: 0.3%
- Baha'is In the hundreds
- Sikhism: In the hundreds
- Hinduism: In the hundreds
- Zoroastrianism: Unknown/unreported
- Christianity: Unknown
- Judaism: 0[58][59]
- Buddhism: Unknown
| Religion | "A survey of the Afghan people" (2004)[51] | "A survey of the Afghan people" (2006)[51] | "A survey of the Afghan people" (2007)[51] | "A survey of the Afghan people" (2008)[51] | "A survey of the Afghan people" (2009)[51] | "A survey of the Afghan people" (2010)[51] | "A survey of the Afghan people" (2011)[51] | "A survey of the Afghan people" (2012)[51] |
|---|---|---|---|---|---|---|---|---|
| Sunni Islam | 92% | " | 87.3% | " | " | " | " | " |
| Shia Islam | 7% | " | 12.3% | " | " | " | " | " |
| Ismailism | 1% | " | 0.4% | " | " | " | " | " |
| Hinduism | 0% | " | 0.1% | " | " | " | " | " |
| Buddhism | 0% | " | 0% | " | " | " | " | " |
| Sikhism | 0% | " | 0% | " | " | " | " | " |
See also
[edit]References
[edit]- ^ a b "Afghanistan: WHO Global Health Observatory Data". World Health Organization. World Health Organization. Retrieved 21 December 2024.
- ^ "Population Growth Rate Explorer: Afghanistan". Our World in Data. Global Change Data Lab. Retrieved 21 December 2024.
- ^ "Birth Rate Explorer: Afghanistan". Our World in Data. Global Change Data Lab. Retrieved 21 December 2024.
- ^ "Death Rate Explorer: Afghanistan". Our World in Data. Global Change Data Lab. Retrieved 21 December 2024.
- ^ "Fertility Rate Explorer: Afghanistan". Our World in Data. Global Change Data Lab. Retrieved 21 December 2024.
- ^ "Infant Mortality Rate Explorer: Afghanistan". Our World in Data. Global Change Data Lab. Retrieved 21 December 2024.
- ^ "World Population Dashboard – Afghanistan". United Nations Population Fund.
- ^ Iwamura, Shinobu (April 1956). "Hunting for the Génghis Khanid Mongols in Afghanistan". Japan Quarterly. 3 (2): 213. ProQuest 1304280677.
- ^ "Mongolian".
- ^ "Mongolian".
- ^ "Mongolian languages summary | Britannica".
- ^ "Critics: New Categories on Afghan IDs Will Incite Ethnic Tension". TOLOnews. 17 March 2021. Retrieved 17 March 2021.
- ^ a b c d e f g h "Afghanistan". The World Factbook. CIA. Retrieved 1 March 2021.
- ^ Lieven, Anatol (21 April 2016). "What Chance for Afghanistan?". The New York Review of Books. Archived from the original on 22 April 2016.
- ^ a b "Afghanistan". UNESCO. 27 November 2016. Archived from the original on 10 May 2017.
- ^ "Afghanistan". World Health Organization (WHO). Retrieved 1 March 2021.
- ^ "Afghanistan". United Nations Development Programme (UNDP). 2020. Retrieved 1 March 2021.
- ^ a b "Article Sixteen of the Constitution of Afghanistan". 2004. Archived from the original on 28 October 2013. Retrieved 25 July 2012.
From among the languages of Pashto, Dari, Uzbeki, Turkmani, Baluchi, Pashai, Nuristani, Pamiri (alsana), Arab and other languages spoken in the country, Pashto and Dari are the official languages of the state.
- ^ a b c d "Chapter 1: Religious Affiliation". The World's Muslims: Unity and Diversity. Pew Research Center's Religion & Public Life Project. 9 August 2012. Archived from the original on 26 December 2016. Retrieved 4 September 2013.
- ^ Lieven, Anatol (2021). "An Afghan Tragedy: The Pashtuns, the Taliban and the State". Survival: Global Politics and Strategy. 63 (3): 7–36. doi:10.1080/00396338.2021.1930403.
- ^ https://unstats.un.org/unsd/demographic-social/products/dyb/dybsets/1983%20DYB.pdf
- ^ CENSUS ii. In Afghanistan Encyclopædia Iranica
- ^ (Gazetteer of Afghanistan VI, p. 333).
- ^ Kandahar Newsletter, 10 August 1891, IOR L/P & S/7/63/1295
- ^ a b "Population". U.S. Library of Congress. 2008. Archived from the original on 19 July 2011. Retrieved 12 October 2010.
- ^ "Afghanistan (1979–2001)". Archived from the original on 5 March 2011. Retrieved 12 October 2010.
- ^ "Afghanistan". Worldmeters. worldmeters.info. Retrieved 30 May 2019.
- ^ a b Mohammad Jawad Sharifzada, ed. (20 November 2011). "Afghanistan's population reaches 26m". Pajhwok Afghan News. Archived from the original on 1 January 2013. Retrieved 5 December 2011.
- ^ Hamdard, Azizullah (10 May 2017). "Afghan Population 29.2 Million". pajhwok.com. Archived from the original on 11 October 2017.
- ^ "Afghanistan – Population Reference Bureau". Population Reference Bureau. Archived from the original on 2 December 2013. Retrieved 29 December 2009.
- ^ "United Nations Statistics Division – Demographic and Social Statistics". United Nations. Archived from the original on 31 March 2016.
- ^ "Demographic Yearbook – 2020". New York: United Nations Statistics Division. Retrieved 18 May 2022.
- ^ "World Population Prospects – Population Division – United Nations". United Nations. Retrieved 13 July 2022.
- ^ "Total fertility rate Comparison – The World Factbook". www.cia.gov.
- ^ "World Bank Open Data". World Bank Open Data.
- ^ "World Bank Open Data". World Bank Open Data.
- ^ "The DHS Program – Quality information to plan, monitor and improve population, health, and nutrition programs" (PDF). Archived (PDF) from the original on 19 October 2014. Retrieved 30 June 2014.
- ^ "STATcompiler". statcompiler.com. Retrieved 17 February 2020.
- ^ "Afghanistan MICS 2022–23" (PDF). mics.unicef.org. Retrieved 30 November 2024.
- ^ "World Population Prospects – Population Division – United Nations". Retrieved 15 July 2017.
- ^ "Afghanistan: Country data and statistics". Retrieved 17 March 2024.
- ^ "Afghanistan: Country data and statistics". Archived from the original on 4 January 2024. Retrieved 17 March 2024.
{{cite web}}: CS1 maint: bot: original URL status unknown (link) - ^ "The World Factbook". cia.gov. Archived from the original on 14 October 2013. Retrieved 11 January 2022.
- ^ "The World Factbok – Afghanistan". The World Factbook/Central Intelligence Agency. University of Missouri. April 1981. Retrieved 12 December 2024.
Ethnic divisions: 50% Pashtun, 25% Tajik, 9% Uzbek, 9% Hazara; minor ethnic groups include Chahar Aimaks, Turkmen, Baluchi and others […] Language: 50% Pashtu, 35% Afghan Persian (Dari), 11% Turkic languages (primarily Uzbek and Turkmen), 4% thirty minor languages (primarily Balochi and Pashai)[,] much bilingualism
- ^ a b "The World Factbok – Afghanistan". The World Factbook/Central Intelligence Agency. University of Missouri. 15 October 1991. Archived from the original on 27 April 2011. Retrieved 20 March 2011.
Ethnic divisions: 50% Pashtun, 25% Tajik, 9% Uzbek, 12–15% Hazara[,] minor ethnic groups include Chahar Aimaks, Turkmen, Baloch, and others […] Language: 50% Pashtu, 35% Afghan Persian (Dari), 11% Turkic languages (primarily Uzbek and Turkmen), 4% thirty minor languages (primarily Balochi and Pashai)[,] much bilingualism
- ^ "Ethnic Groups". Library of Congress Country Studies. 1997. Archived from the original on 10 January 2009. Retrieved 8 October 2010.
In 1996, approximately 40 percent of Afghans were Pashtun, 11.4 of whom are of the Durrani tribal group and 13.8 percent of the Ghilzai group. Tajiks make up the second largest ethnic group with 25.3 percent of the population, followed by Hazaras, 18 percent; Uzbeks, 6.3 percent; Turkmen, 2.5 percent; Qizilbash, 1.0; 6.9 percent other. The usual caveat regarding statistics is particularly appropriate here.
- ^ "PEOPLE – Ethnic divisions". The World Factbook/Central Intelligence Agencyu. University of Missouri. 22 January 1993. Archived from the original on 9 October 1999. Retrieved 20 March 2011.
Pashtun 38%, Tajik 25%, Uzbek 6%, Hazara 19%; minor ethnic groups include Chahar Aimaks, Turkmen, Baloch, and others
- ^ Mobasher, Mohammad Bashir. Political Laws and Ethnic Accommodation: Why Cross-Ethnic Coalitions Have Failed to Institutionalize in Afghanistan. Diss. 2017, p. 42. Link: [1]
- ^ Hawthorne, Susan; Winter, Bronwyn (2002). 11 September 2001: feminist perspectives. Spinifex Press. p. 225. ISBN 1-876756-27-6. Retrieved 24 September 2010.
Over 60 percent of the population in Afghanistan is Pashtun...
- ^ [Brown, Keith; Ogilvie, Sarah (2009). Concise encyclopedia of languages of the world. Elsevie. p. 845. ISBN 978-0-08-087774-7. Retrieved 24 September 2010.
Pashto, which is mainly spoken south of the mountain range of the Hindu Kush, is reportedly the mother tongue of 60% of the Afghan population.
] - ^ a b c d e f g h i j k l m n o p See:
- "Afghanistan in 2019 – A survey of the Afghan people" (PDF). Kabul, Afghanistan: The Asia Foundation. p. 277. Archived from the original (PDF) on 15 September 2021. Retrieved 15 September 2021.
D-14. Which ethnic group do you belong to?
- "Afghanistan in 2018 – A survey of the Afghan people" (PDF). Kabul, Afghanistan: The Asia Foundation. p. 243. Archived from the original (PDF) on 7 August 2019. Retrieved 31 December 2018.
D-14. WHICH ETHNIC GROUP DO YOU BELONG TO?
- "Afghanistan in 2012 – A survey of the Afghan people" (PDF). Kabul, Afghanistan: The Asia Foundation. p. 182. Archived (PDF) from the original on 15 November 2012. Retrieved 28 November 2012.
Ethnicity Status
- "Afghanistan in 2010 – A survey of the Afghan people" (PDF). Kabul, Afghanistan: The Asia Foundation. 2010. pp. 225–226. Archived (PDF) from the original on 19 July 2011. Retrieved 20 March 2011.
D-9. Which ethnic group do you belong to? SINGLE RESPONSE ONLY Pashtun 48%, Tajik 25%, Uzbek 9%, Hazara 10%, Turkmen 2%, Baloch 1%, Nuristani 1%, Aimak 2%, Arab 2%
- "Afghanistan in 2009: A Survey of the Afghan People" (PDF). Kabul, Afghanistan: The Asia Foundation. Archived (PDF) from the original on 7 September 2012. Retrieved 28 November 2012.
The 2009 survey interviewed 6,406 Afghans (53% men and 47% women)
- "Afghanistan in 2010 – A survey of the Afghan people" (PDF). Kabul, Afghanistan: The Asia Foundation. Archived (PDF) from the original on 5 September 2012. Retrieved 28 November 2012.
The 2008 survey interviewed 6,593 Afghans...
- "Afghanistan in 2007 – A survey of the Afghan people" (PDF). Kabul, Afghanistan: The Asia Foundation. 2010. pp. 225–226. Archived (PDF) from the original on 13 August 2011. Retrieved 20 March 2011.
The 2007 survey interviewed 6,406 Afghans, Which ethnic group do you belong to? SINGLE RESPONSE ONLY Pashtun 55%, Tajik 25%, Uzbek 8%, Hazara 15%, Turkmen 8%, Baloch 1%, Nuristani 1%, Aimak 1%, Arab 1%
- "Afghanistan in 2006 – A survey of the Afghan people" (PDF). Kabul, Afghanistan: The Asia Foundation. pp. 83–88. Archived from the original (PDF) on 13 April 2012. Retrieved 28 November 2012.
A total of 6,226 respondents were surveyed in the study, out of which 4888 (78.5%) were from the rural areas and 1338 (22%) were from the urban areas. Ethnicity: Pashtun 40.9, Tajik 37.1, Uzbek 9.2, Hazara 9.2, Turkmen 1.7, Baloch 0.5, Nuristani 0.4, Aimak 0.1, Arab 0.7, Pashayi 0.3
- "Afghanistan in 2004 – A survey of the Afghan people" (PDF). Kabul, Afghanistan: The Asia Foundation. 2004. Archived (PDF) from the original on 6 September 2012. Retrieved 28 November 2012.
The 2004 survey interviewed 804 Afghans, Which ethnic group do you belong to? Pashtun 40%, Tajik 39%, Uzbek 6%, Hazara 6%, Turkmen 1%, Baloch 0%, Nuristani 1%, Aimak 0%, Arab 1%, Pashaye 0%, Other 1%.
- "Afghanistan in 2019 – A survey of the Afghan people" (PDF). Kabul, Afghanistan: The Asia Foundation. p. 277. Archived from the original (PDF) on 15 September 2021. Retrieved 15 September 2021.
- ^ a b c d e f g "ABC NEWS/BBC/ARD poll – Afghanistan: Where Things Stand" (PDF). ABC News. Kabul, Afghanistan. pp. 38–40. Archived (PDF) from the original on 28 June 2011. Retrieved 29 October 2010.
- ^ a b "Languages – The World Factbook". www.cia.gov.
- ^ "AFGHANISTAN v. Languages". Ch. M. Kieffer. Encyclopædia Iranica. Archived from the original on 29 April 2011. Retrieved 10 October 2010.
A. Official languages. Pashto (1) is the language most spoken in Afghanistan. The native tongue of 65–70% of the population. Persian (2) is the native tongue of 30–35% of Afghans. Persian is split into numerous dialects.
- ^ "Languages of Afghanistan". SIL International. Ethnologue: Languages of the World. Archived from the original on 30 January 2009. Retrieved 18 September 2010.
- ^ "Afghanistan, Religion and Social Profile". Archived from the original on 12 June 2021. Retrieved 26 July 2021.
- ^ "Nearly 99% Of Hindus, Sikhs Left Afghanistan in Last Three decades". TOLOnews. 20 June 2016.
- ^ "Last Jew in Afghanistan en route to US: report". The New Arab. 7 September 2021. Retrieved 17 September 2021.
- ^ Mehrdad, Ezzatullah (16 July 2019). "Kabul, with Jewish population of 1, still suffers from widespread anti-Semitism". The Times of Israel. Retrieved 9 September 2021.
Further reading
[edit]- Banting, Erinn. Afghanistan the People. Crabtree Publishing Company, 2003. ISBN 0-7787-9336-2.
- Caroe, Olaf (1958). The Pathans: 500 B.C.-A.D. 1957. Oxford in Asia Historical Reprints. Oxford University Press, 1983. ISBN 0-19-577221-0.
- Dupree, Nancy Hatch. An Historical Guide to Afghanistan. 2nd Edition. Revised and Enlarged. Afghan Air Authority, Afghan Tourist Organization, 1977.
- Elphinstone, Mountstuart. 1819. An account of the kingdom of Caubul, and its dependencies in Persia, Tartary, and India: Comprising a view of the Afghaun nation, and a history of the Dooraunee monarchy. Printed for Longman, Hurst, Rees, Orme, and Brown, and J. Murry, 1819.
- Habibi, Abdul Hai. 2003. "Afghanistan: An Abridged History." Fenestra Books. ISBN 1-58736-169-8.
- Hopkins, B. D. 2008. The Making of Modern Afghanistan. Palgrave Macmillan, 2008. ISBN 0-230-55421-0.
- Reddy, L. R. Inside Afghanistan: end of the Taliban era?. APH Publishing, 2002. ISBN 81-7648-319-2.
- Amy Romano. A Historical Atlas of Afghanistan. The Rosen Publishing Group, 2003. ISBN 0-8239-3863-8.
- Vogelsang, Willem. The Afghans. Wiley-Blackwell, 2002. Oxford, UK & Massachusetts, US. ISBN 0-631-19841-5.
External links
[edit]- National Statistic and Information Authority (NSIA) Archived 11 September 2021 at the Wayback Machine
- Afghanistan – USAID
- Afghanistan – Naval Postgraduate School
- Afghan refugees in Pakistan – UNHCR
